RF Pipe Radio Model
The RF Pipe radio model is a generic model designed for use as a surrogate for waveforms without a model of their own.
Features
The RF Pipe radio model provides the following set of features: Network Delay Emulation and Packet Completion Rate Curves.
Network Delay Emulation
The RF Pipe radio model allows for downstream transmission network delay emulation using a configurable delay and jitter. The RF Pipe model will apply a network delay before a message is sent to the physical layer for over-the-air transmission.
The network delay is computed as follows:
\[networkDelay = delay + jitter\]Where,
-
\(delay\) is defined by the configuration parameter
delay. -
\(jitter\) is defined by the configuration parameter
jitter.
Packet Completion Rate Curves
The RF Pipe radio model Packet Completion Rate is specified as a curve defined via XML. The curve definition comprises a series of SINR values along with their corresponding probability of reception.
A curve definition must contain a minimum of two points with one SINR representing POR = 0 and one SINR representing POR = 100. Linear interpolation is preformed when an exact SINR match is not found.
Specifying a packet size (<table> attribute pktsize) in the curve file will adjust the POR based on received packet size. Specifying a pktsize of 0 disregards received packet size when computing the POR.
The POR is obtained using the following calculation when a non-zero pktsize is specified:
Where,
\(POR_0\) is the POR value determined from the PCR curve for the given SINR value
\(S_0\) is the packet size specified in the curve file pktsize
\(S_1\) is the received packet size
The below PCR curve file is used by all nodes in the rfpipe-01 example. This curve is for illustrative purposes only. Packet Completion Rate curves should be representative of the waveform being emulated.
<?xml version="1.0" encoding="UTF-8"?>
<!DOCTYPE pcr SYSTEM "file:///usr/share/emane/dtd/rfpipepcr.dtd">
<pcr>
    <table pktsize="0">
        <row sinr="0.0" por="0"/>
        <row sinr="0.5"	por="2.5"/>
        <row sinr="1.0"	por="5"/>
        <row sinr="1.5"	por="7.5"/>
        <row sinr="2.0"	por="10"/>
        <row sinr="2.5"	por="12.5"/>
        <row sinr="3.0"	por="15"/>
        <row sinr="3.5"	por="17.5"/>
        <row sinr="4.0"	por="20"/>
        <row sinr="4.5"	por="22.5"/>
        <row sinr="5.0"	por="25"/>
        <row sinr="5.5"	por="27.5"/>
        <row sinr="6.0"	por="30"/>
        <row sinr="6.5"	por="32.5"/>
        <row sinr="7.0"	por="35"/>
        <row sinr="7.5"	por="37.5"/>
        <row sinr="8.0"	por="40"/>
        <row sinr="8.5"	por="42.5"/>
        <row sinr="9.0" por="45"/>
        <row sinr="9.5" por="47.5"/>
        <row sinr="10.0" por="50"/>

<... snippet: only 25 lines shown...>
emane-guide/examples/rfpipe-01/node-1/emane-rfpipe-pcr.xml
Packet Completion Rate (PCR) curves should be representative of the waveform being emulated. The curve used for the RF Pipe radio model example is for illustrative purposes only.
Limitations
The RF Pipe radio model has the following limitations:
-
The RF Pipe radio model does not perform channel access. Since there is no channel access protocol, the data rate defines the transmission capacity of each node within the network.
-
The RF Pipe radio model does not apply any in-band interference effects, and as such, the use of negative SINR values within the PCR curve is valid only when the physical layer
noisemodeconfiguration value is set tooutofbandin order to raise the noise floor above the inherent receiver sensitivity.
Configuration
-
datarate: Defines the transmit datarate in bps. The datarate is used by the transmitter to compute the transmit delay (packet size/datarate) between successive transmissions.Default: yes Required: no Modifiable: yes Type: uint64 Occurrs: [1,1] Range: [1,max_uint64] Values: 1000000 -
delay: Defines an additional fixed delay in seconds applied to each transmitted packet.Default: yes Required: no Modifiable: yes Type: float Occurrs: [1,1] Range: [0.000000,max_float] Values: 0.000000 -
enablepromiscuousmode: Defines whether promiscuous mode is enabled or not. If promiscuous mode is enabled, all received packets (intended for the given node or not) that pass the probability of reception check are sent upstream to the transport.Default: yes Required: no Modifiable: yes Type: bool Occurrs: [1,1] Range: [false,true] Values: false -
flowcontrolenable: Defines whether flow control is enabled. Flow control only works with the virtual transport and the setting must match the setting within the virtual transport configuration.Default: yes Required: no Modifiable: no Type: bool Occurrs: [1,1] Range: [false,true] Values: false -
flowcontroltokens: Defines the maximum number of flow control tokens (packet transmission units) that can be processed from the virtual transport without being refreshed. The number of available tokens at any given time is coordinated with the virtual transport and when the token count reaches zero, no further packets are transmitted causing application socket queues to backup.Default: yes Required: no Modifiable: no Type: uint16 Occurrs: [1,1] Range: [0,65535] Values: 10 -
jitter: Defines delay jitter in seconds applied to each transmitted packet. The jitter is added to the configured delay based on a uniform random distribution between +/- the configured jitter value.Default: yes Required: no Modifiable: yes Type: float Occurrs: [1,1] Range: [0.000000,max_float] Values: 0.000000 -
neighbormetricdeletetime: Defines the time in seconds of no RF receptions from a given neighbor before it is removed from the neighbor table.Default: yes Required: no Modifiable: yes Type: float Occurrs: [1,1] Range: [1.000000,3660.000000] Values: 60.000000 -
pcrcurveuri: Defines the URI of the Packet Completion Rate (PCR) curve file. The PCR curve file contains probability of reception curves as a function of Signal to Interference plus Noise Ratio (SINR).Default: no Required: yes Modifiable: no Type: string Occurrs: [1,1] -
radiometricenable: Defines if radio metrics will be reported up via the Radio to Router Interface (R2RI).Default: yes Required: no Modifiable: no Type: bool Occurrs: [1,1] Range: [false,true] Values: false -
radiometricreportinterval: Defines the metric report interval in seconds in support of the R2RI feature.Default: yes Required: no Modifiable: no Type: float Occurrs: [1,1] Range: [0.100000,60.000000] Values: 1.000000 -
rfsignaltable.averageallantennas: Defines whether statistics for all antennas with be averaged together.Default: yes Required: no Modifiable: no Type: bool Occurrs: [1,1] Range: [false,true] Values: false -
rfsignaltable.averageallfrequencies: Defines whether statistics for all frequencies with be averaged together.Default: yes Required: no Modifiable: no Type: bool Occurrs: [1,1] Range: [false,true] Values: false
Statistics
-
avgDownstreamProcessingDelay0: Average downstream processing delayType: float Clearable: yes -
avgDownstreamQueueDelay:Type: float Clearable: yes -
avgProcessAPIQueueDepth: Average API queue depth for a processUpstreamPacket, processUpstreamControl, processDownstreamPacket, processDownstreamControl, processEvent and processTimedEvent.Type: double Clearable: yes -
avgProcessAPIQueueWait: Average API queue wait for a processUpstreamPacket, processUpstreamControl, processDownstreamPacket, processDownstreamControl, processEvent and processTimedEvent in microseconds.Type: double Clearable: yes -
avgTimedEventLatency: Average latency between the scheduled timer expiration and the actual firing over the requested duration.Type: double Clearable: yes -
avgTimedEventLatencyRatio: Average ratio of the delta between the scheduled timer expiration and the actual firing over the requested duration. An average ratio approaching 1 indicates that timer latencies are large in comparison to the requested durations.Type: double Clearable: yes -
avgUpstreamProcessingDelay0: Average upstream processing delayType: float Clearable: yes -
numAPIQueued: The number of queued API events.Type: uint64 Clearable: yes -
numDownstreamBytesBroadcastGenerated0: Number of layer generated downstream broadcast bytesType: uint64 Clearable: yes -
numDownstreamBytesBroadcastRx0: Number of downstream broadcast bytes receivedType: uint64 Clearable: yes -
numDownstreamBytesBroadcastTx0: Number of downstream broadcast bytes transmittedType: uint64 Clearable: yes -
numDownstreamBytesUnicastGenerated0: Number of layer generated downstream unicast bytesType: uint64 Clearable: yes -
numDownstreamBytesUnicastRx0: Number of downstream unicast bytes receivedType: uint64 Clearable: yes -
numDownstreamBytesUnicastTx0: Number of downstream unicast bytes transmittedType: uint64 Clearable: yes -
numDownstreamPacketsBroadcastDrop0: Number of downstream broadcast packets droppedType: uint64 Clearable: yes -
numDownstreamPacketsBroadcastGenerated0: Number of layer generated downstream broadcast packetsType: uint64 Clearable: yes -
numDownstreamPacketsBroadcastRx0: Number of downstream broadcast packets receivedType: uint64 Clearable: yes -
numDownstreamPacketsBroadcastTx0: Number of downstream broadcast packets transmittedType: uint64 Clearable: yes -
numDownstreamPacketsUnicastDrop0: Number of downstream unicast packets droppedType: uint64 Clearable: yes -
numDownstreamPacketsUnicastGenerated0: Number of layer generated downstream unicast packetsType: uint64 Clearable: yes -
numDownstreamPacketsUnicastRx0: Number of downstream unicast packets receivedType: uint64 Clearable: yes -
numDownstreamPacketsUnicastTx0: Number of downstream unicast packets transmittedType: uint64 Clearable: yes -
numDownstreamQueueDelay: Accumulation of downstream queue delay in microseconds.Type: uint64 Clearable: yes -
numHighWaterMark: Downstream queue high water mark in packets.Type: uint32 Clearable: yes -
numUpstreamBytesBroadcastRx0: Number of upstream broadcast bytes receivedType: uint64 Clearable: yes -
numUpstreamBytesBroadcastTx0: Number of updtream broadcast bytes transmittedType: uint64 Clearable: yes -
numUpstreamBytesUnicastRx0: Number upstream unicast bytes receivedType: uint64 Clearable: yes -
numUpstreamBytesUnicastTx0: Number of upstream unicast bytes transmittedType: uint64 Clearable: yes -
numUpstreamPacketsBroadcastDrop0: Number of upstream broadcast packets droppedType: uint64 Clearable: yes -
numUpstreamPacketsBroadcastRx0: Number of upstream broadcast packets receivedType: uint64 Clearable: yes -
numUpstreamPacketsBroadcastTx0: Number of upstream broadcast packets transmittedType: uint64 Clearable: yes -
numUpstreamPacketsUnicastDrop0: Number of upstream unicast packets droppedType: uint64 Clearable: yes -
numUpstreamPacketsUnicastRx0: Number upstream unicast packets receivedType: uint64 Clearable: yes -
numUpstreamPacketsUnicastTx0: Number of upstream unicast packets transmittedType: uint64 Clearable: yes -
processedConfiguration: The number of processed configuration.Type: uint64 Clearable: yes -
processedDownstreamControl: The number of processed downstream control.Type: uint64 Clearable: yes -
processedDownstreamPackets: The number of processed downstream packets.Type: uint64 Clearable: yes -
processedEvents: The number of processed events.Type: uint64 Clearable: yes -
processedTimedEvents: The number of processed timed events.Type: uint64 Clearable: yes -
processedUpstreamControl: The number of processed upstream control.Type: uint64 Clearable: yes -
processedUpstreamPackets: The number of processed upstream packets.Type: uint64 Clearable: yes
Statistic Tables
-
BroadcastPacketAcceptTable0: Broadcast packets acceptedClearable: yes -
BroadcastPacketDropTable0: Broadcast packets dropped by reason codeClearable: yes -
EventReceptionTable: Received event countsClearable: yes -
NeighborMetricTable: Neighbor Metric TableClearable: no -
NeighborStatusTable: Neighbor Status TableClearable: no -
RFSignalTable: Rf Signal TableClearable: no -
UnicastPacketAcceptTable0: Unicast packets acceptedClearable: yes -
UnicastPacketDropTable0: Unicast packets dropped by reason codeClearable: yes
Examples
This guide includes the RF Pipe example:
rfpipe-01: A five node example using precomputed pathloss and running the B.A.T.M.A.N manet protocol.
rfpipe-01
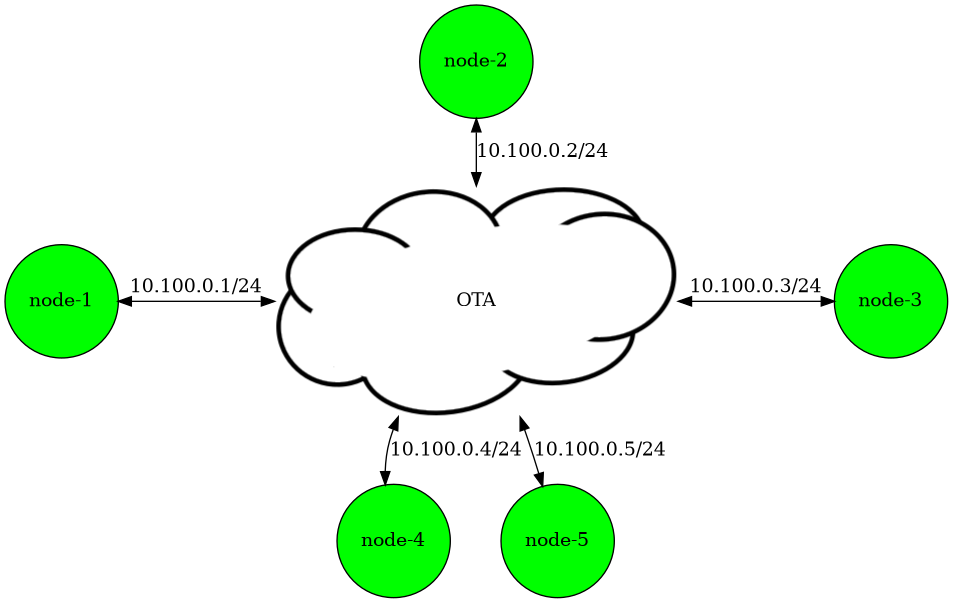
rfpipe-01 experiment components
The rfpipe-01 example experiment contains five nodes, each running the B.A.T.M.A.N. routing protocol.
All physical layers are configured to use the precomputed propagation model and emaneeventservice publishes PathlossEvents using pathloss values in scenario.eel.
0.0  nem:1 pathloss nem:2,70
0.0  nem:1 pathloss nem:3,70
0.0  nem:1 pathloss nem:4,70
0.0  nem:1 pathloss nem:5,70

0.0  nem:2 pathloss nem:3,70
0.0  nem:2 pathloss nem:4,70
0.0  nem:2 pathloss nem:5,70

0.0  nem:3 pathloss nem:4,70
0.0  nem:3 pathloss nem:5,70

0.0  nem:4 pathloss nem:5,70
emane-guide/examples/rfpipe-01/host/scenario.eel

With emane-guide/examples/rfpipe-01 running, we can query node-1’s physical layer to take a look at the PathlossEventInfoTable and ReceivePowerTable.
$ emanesh node-1 get table nems phy PathlossEventInfoTable ReceivePowerTable
nem 1   phy PathlossEventInfoTable
| NEM | Forward Pathloss | Reverse Pathloss |
| 2   | 70.0             | 70.0             |
| 3   | 70.0             | 70.0             |
| 4   | 70.0             | 70.0             |
| 5   | 70.0             | 70.0             |

nem 1   phy ReceivePowerTable
|NEM|Rx Antenna|Tx Antenna|Frequency |Rx Power|Tx Gain|Rx Gain|Tx Power|Pathloss|Doppler|Last Packet Time  |
|2  |0         |0         |2400000000|-70.0   |0.0    |0.0    |0.0     |70.0    |0.0    |1688147153.189406 |
|3  |0         |0         |2400000000|-70.0   |0.0    |0.0    |0.0     |70.0    |0.0    |1688147153.293473 |
|4  |0         |0         |2400000000|-70.0   |0.0    |0.0    |0.0     |70.0    |0.0    |1688147153.2934668|
|5  |0         |0         |2400000000|-70.0   |0.0    |0.0    |0.0     |70.0    |0.0    |1688147153.30126  |
The PathlossEventInfoTable shows pathloss values matching those in scenario.eel. Only the Forward Pathloss value is used by the physical layer. The Reverse Pathloss value is an unused legacy value but still useful when analyzing an experiment as it indicates if link pathloss is symmetrical without requiring correlation of values between nodes.
Using the Receive Power Calculation, we can verify the Rx Power value from the ReceivePowerTable.
Testing connectivity between node-1 and all nodes using fping shows 100% completion in both directions.
$ ssh node-1 fping -N -C 2 radio-2 radio-3 radio-4 radio-5
radio-2 : [0], 64 bytes, 0.707 ms (0.707 avg, 0% loss)
radio-3 : [0], 64 bytes, 0.918 ms (0.918 avg, 0% loss)
radio-4 : [0], 64 bytes, 0.780 ms (0.780 avg, 0% loss)
radio-5 : [0], 64 bytes, 1.25 ms (1.25 avg, 0% loss)
radio-2 : [1], 64 bytes, 1.67 ms (1.19 avg, 0% loss)
radio-3 : [1], 64 bytes, 1.40 ms (1.16 avg, 0% loss)
radio-4 : [1], 64 bytes, 1.65 ms (1.21 avg, 0% loss)
radio-5 : [1], 64 bytes, 1.45 ms (1.35 avg, 0% loss)

radio-2 : 0.707 1.67
radio-3 : 0.918 1.40
radio-4 : 0.780 1.65
radio-5 : 1.25 1.45
Using emanesh we can modify the latency for node-2 to add 200msec of delay to all transmitted packets and then rerun fping to verify the results.
$ emanesh node-2 get config nems mac delay
nem 2   mac  delay = 0.0
$ emanesh node-2 set config nems mac delay=.2
nem 2   mac  configuration updated
$ ssh node-1 fping -N -C 2 radio-2 radio-3 radio-4 radio-5
radio-3 : [0], 64 bytes, 0.864 ms (0.864 avg, 0% loss)
radio-4 : [0], 64 bytes, 0.871 ms (0.871 avg, 0% loss)
radio-5 : [0], 64 bytes, 2.07 ms (2.07 avg, 0% loss)
radio-2 : [0], 64 bytes, 202 ms (202 avg, 0% loss)
radio-3 : [1], 64 bytes, 1.91 ms (1.39 avg, 0% loss)
radio-4 : [1], 64 bytes, 2.05 ms (1.46 avg, 0% loss)
radio-5 : [1], 64 bytes, 1.37 ms (1.72 avg, 0% loss)
radio-2 : [1], 64 bytes, 202 ms (202 avg, 0% loss)

radio-2 : 202 202
radio-3 : 0.864 1.91
radio-4 : 0.871 2.05
radio-5 : 2.07 1.37
Connectivity is still 100% between node-1 and all nodes but now there is an additional 200msec of latency from node-2’s response.
Using otestpoint-labtools-mtabletool to subscribe to all EMANE.RFPipe.Tables.Receive probes, we can build a combined RF Signal table showing the number of samples in each measurement interval and the measurement interval averages computed from long running averages for receive power, noise floor, and SINR.
$ otestpoint-labtools-mtabletool \
    localhost:9002 \
    Measurement_emane_rfpipe_tables_receive@rfsignaltable \
    EMANE.RFPipe.Tables.Receive \
    --actions \
    "pass(c=(0-2));" \
    "delta(c=(3))=>|{}_intvl|;" \
    "iavg(c=(4,5,6),n=(3))=>|{}_intvl|;"
The rfsignaltable published as part of Measurement_emane_rfpipe_tables_receive, like all OpenTestPoint measurements, is updated every 5 seconds.
 Measurement_emane_rfpipe_tables_receive@rfsignaltable
    _Publisher  NEM  AntennaId  FrequencyHz  NumSamples_intvl  AvgRxPower_intvl  AvgNoiseFloor_intvl  AvgSINR_intvl
0      node-1    2          0   2400000000                69             -70.0             -96.9897        26.9897
1      node-1    3          0   2400000000                69             -70.0             -96.9897        26.9897
2      node-1    4          0   2400000000                69             -70.0             -96.9897        26.9897
3      node-1    5          0   2400000000                69             -70.0             -96.9897        26.9897
4      node-2    1          0   2400000000                69             -70.0             -96.9897        26.9897
5      node-2    3          0   2400000000                69             -70.0             -96.9897        26.9897
6      node-2    4          0   2400000000                69             -70.0             -96.9897        26.9897
7      node-2    5          0   2400000000                69             -70.0             -96.9897        26.9897
8      node-3    1          0   2400000000                69             -70.0             -96.9897        26.9897
9      node-3    2          0   2400000000                69             -70.0             -96.9897        26.9897
10     node-3    4          0   2400000000                69             -70.0             -96.9897        26.9897
11     node-3    5          0   2400000000                69             -70.0             -96.9897        26.9897
12     node-4    1          0   2400000000                69             -70.0             -96.9897        26.9897
13     node-4    2          0   2400000000                69             -70.0             -96.9897        26.9897
14     node-4    3          0   2400000000                69             -70.0             -96.9897        26.9897
15     node-4    5          0   2400000000                69             -70.0             -96.9897        26.9897
16     node-5    1          0   2400000000                69             -70.0             -96.9897        26.9897
17     node-5    2          0   2400000000                69             -70.0             -96.9897        26.9897
18     node-5    3          0   2400000000                69             -70.0             -96.9897        26.9897
19     node-5    4          0   2400000000                69             -70.0             -96.9897        26.9897
The table output shows AvgRxPower_intvl matches the Rx Power from the physical layer ReceivePowerTable and that the AvgSINR_intvl between all nodes is 26.9dB. Taking a look at the RF Pipe PCR curve used for this example, emane-guide/examples/rfpipe-01/node-1/emane-rfpipe-pcr.xml, any SINR over 20dB will have a 100% probability of completion.
In order to experience 50% loss on each link, reduce the SINR to 10dB. This can be achieved by increasing the pathloss between nodes to 86.98dB. The emaneevent-pathloss script is a quick way to change pathloss while investigating an experiment, provided emaneeventservice is not actively publishing pathloss changes.
$ emaneevent-pathloss -i letce0 1:5 86.98
The pathloss increase results in an AvgSINR_intvl of 10.009697 which maps to an approximate POR of 50% within emane-guide/examples/rfpipe-01/node-1/emane-rfpipe-pcr.xml.
  Measurement_emane_rfpipe_tables_receive@rfsignaltable
    _Publisher  NEM  AntennaId  FrequencyHz  NumSamples_intvl  AvgRxPower_intvl  AvgNoiseFloor_intvl  AvgSINR_intvl
0      node-1    2          0   2400000000                22        -86.980003             -96.9897      10.009697
1      node-1    3          0   2400000000                27        -86.980003             -96.9897      10.009697
2      node-1    4          0   2400000000                25        -86.980003             -96.9897      10.009697
3      node-1    5          0   2400000000                22        -86.980003             -96.9897      10.009697
4      node-2    1          0   2400000000                21        -86.980003             -96.9897      10.009697
5      node-2    3          0   2400000000                21        -86.980003             -96.9897      10.009697
6      node-2    4          0   2400000000                21        -86.980003             -96.9897      10.009697
7      node-2    5          0   2400000000                17        -86.980003             -96.9897      10.009697
8      node-3    1          0   2400000000                20        -86.980003             -96.9897      10.009697
9      node-3    2          0   2400000000                25        -86.980003             -96.9897      10.009697
10     node-3    4          0   2400000000                26        -86.980003             -96.9897      10.009697
11     node-3    5          0   2400000000                26        -86.980003             -96.9897      10.009697
12     node-4    1          0   2400000000                28        -86.980003             -96.9897      10.009697
13     node-4    2          0   2400000000                27        -86.980003             -96.9897      10.009697
14     node-4    3          0   2400000000                25        -86.980003             -96.9897      10.009697
15     node-4    5          0   2400000000                22        -86.980003             -96.9897      10.009697
16     node-5    1          0   2400000000                23        -86.980003             -96.9897      10.009697
17     node-5    2          0   2400000000                26        -86.980003             -96.9897      10.009697
18     node-5    3          0   2400000000                27        -86.980003             -96.9897      10.009697
19     node-5    4          0   2400000000                26        -86.980003             -96.9897      10.009697
Using ping as a quick test shows an approximate completion of 25%. Which makes sense, 50% loss in each direction would yield a 25% completion rate.
$ ssh node-1 ping radio-2 -i .02 -c 1000 -q
PING radio-2 (10.100.0.2) 56(84) bytes of data.

--- radio-2 ping statistics ---
1000 packets transmitted, 234 received, 76.6% packet loss, time 20966ms
rtt min/avg/max/mdev = 0.500/1.540/2.649/0.447 ms